| Title | Size | Downloads |
|---|---|---|
| H3C S5500-EI[SI] Troubleshooting Guide-6W100-book.pdf | 298.16 KB |
- Table of Contents
- Related Documents
H3C S5500-EI & S5500-SI Switch Series Troubleshooting Guide
|
Copyright ? 2014 Hangzhou H3C Technologies Co., Ltd. All rights reserved. No part of this manual may be reproduced or transmitted in any form or by any means without prior written consent of Hangzhou H3C Technologies Co., Ltd. The information in this document is subject to change without notice. |
|
Contents
ACL application failure with an error message
ACL application failure without an error message
IRF fabric establishment failure
Troubleshooting Ethernet link aggregation
Troubleshooting other problems
Introduction
This document provides troubleshooting information for H3C S5500-EI and S5500-SI switches. This document applies to the H3C S5500-EI & S5500-SI Switch Series in Release 2208 and later versions.
Troubleshooting ACL
This section provides troubleshooting information for common problems with ACLs.
ACL application failure with an error message
Symptom
The system fails to apply a packet filter or ACL-based classifiers in a QoS policy to the hardware. It also displays this message: "Reason: Not enough hardware resource."
Solution
To resolve this problem:
1. Execute the display acl resource command, and then check the Remaining field for ACL resources insufficiency.
If this field displays 0, the ACL hardware resources are exhausted.
2. To free hardware resources, remove unused packet filters or ACL-based classifiers from QoS policies.
3. If the problem persists, contact H3C Support.
ACL application failure without an error message
Symptom
The system applies a packet filter or a QoS policy that contains ACLs to the hardware. However, the ACL does not take effect.
Troubleshooting flowchart
Figure 1 Troubleshooting an ACL application failure
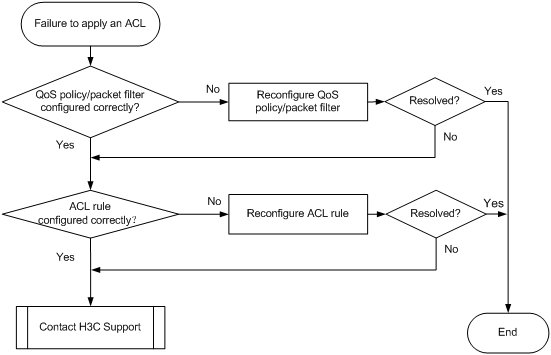
Solution
Choose a solution depending on the module that uses the ACL.
ACL used in a QoS policy
To resolve the problem when the ACL is used in a QoS policy:
1. Verify that the QoS policy is configured correctly:
a. Use one of the following commands to check the QoS policy for configuration errors, depending on the policy application destination:
|
Destination |
Command |
|
Interface |
display qos policy interface |
|
VLAN |
display qos vlan-policy |
|
Global |
display qos policy global |
|
Control plane |
display qos policy control-plane slot slot-number |
b. If the QoS policy does not contain a class-behavior association, associate the traffic behavior with the traffic class.
c. If the QoS policy contains a class-behavior association, execute the display traffic classifier user-defined command and the display traffic behavior user-defined command to check for traffic class and behavior configuration errors, respectively.
- If they are configured incorrectly, reconfigure them.
- If they are configured correctly, go to Step 2.
2. Verify that the ACL is configured correctly:
a. Execute the display acl command.
b. If the ACL is configured incorrectly, reconfigure it.
3. If the problem persists, contact H3C Support.
ACL used in a packet filter
To resolve the problem when the ACL is used in a packet filter:
1. Verify that the packet filter is configured correctly:
a. Execute the display packet-filter command.
b. If there are any configuration errors, reconfigure the packet filter.
2. Verify that the ACL is configured correctly:
a. Execute the display acl command.
b. If there are any configuration errors, reconfigure the ACL.
3. If the problem persists, contact H3C Support.
Related commands
This section lists the commands that you might use for troubleshooting ACLs.
|
Command |
Description |
|
display acl resource |
Displays information about hardware resources for ACL applications. |
|
display packet-filter |
Displays whether an ACL has been successfully applied to an interface for packet filtering. |
|
display qos policy control-plane |
Displays information about the QoS policies applied to the specified control plane. |
|
display qos policy global |
Displays information about global QoS policies. |
|
display qos policy interface |
Displays information about the QoS policies applied to an interface or to all interfaces. |
|
display qos vlan-policy |
Displays information about QoS policies applied to VLANs. |
|
display traffic classifier user-defined |
Displays traffic class configurations. |
|
display traffic behavior user-defined |
Displays traffic behavior configurations. |
Troubleshooting IRF
This section provides troubleshooting information for common problems with IRF.
IRF fabric establishment failure
Symptom
An IRF fabric cannot be established.
Troubleshooting flowchart
Figure 2 Troubleshooting IRF fabric establishment failure
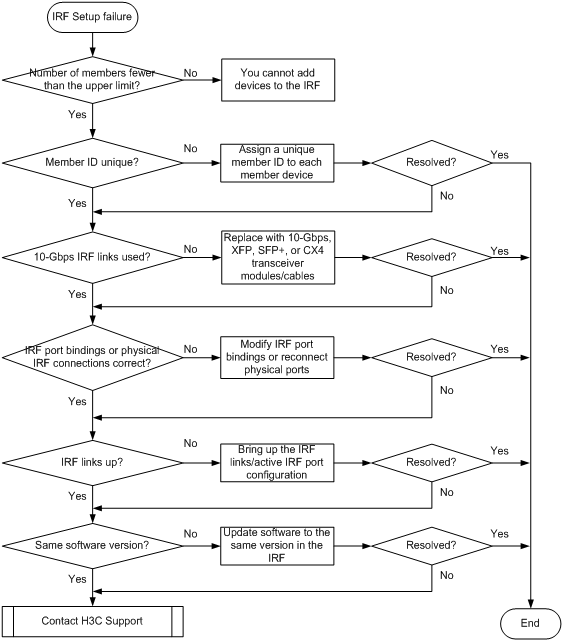
Solution
To resolve the problem:
1. Verify that the number of member devices does not exceed the upper limit (nine for an S5500-EI IRF fabric and four for an S5500-SI IRF fabric).
If you are adding a new member device to an existing IRF fabric, use the display irf command to identify the number of member devices already in the IRF fabric.
2. Verify that the member ID of each member device is unique:
a. Execute the display irf configuration command to view the member ID of each member device.
b. If two member devices use duplicate IDs, assign a unique member ID to each member.
3. Verify that the IRF links are 10 Gbps:
a. Verify that the IRF physical ports are located on the rear 10-GE expansion interface cards. The following are available 10-GE expansion interface cards:
- Single-port 10G XFP interface card (LSPM1XP1P)
- 2-port 10G XFP interface card (LSPM1XP2P)
- Short-haul 2-port 10G CX4 interface card (LSPM1CX2P)
- 2-port 10G SFP+ interface card (LSPM2SP2P)
- 2-port 1/10GBase-T interface card (LSPM1XGT2P)
b. Verify that the transceiver modules or cables for IRF connection are labeled with 10Gbps, XFP, SFP+, or CX4.
c. Replace a transceiver module or cable if it is not for 10-Gbps connection.
4. Verify that the IRF port bindings and physical IRF link connections are correct:
|
|
IMPORTANT: When you connect two neighboring IRF members, you must connect the physical ports of IRF-port 1 on one member to the physical ports of IRF-port 2 on the other. |
a. Execute the display irf configuration command on each member device, and check the IRF-Port1 and IRF-Port2 fields for IRF port bindings.
b. Verify the following items:
- The physical ports on the same expansion interface card are bound to the same IRF port.
- When you are facing the rear panel, the physical ports bound to IRF-port 1 are on the left and the physical ports bound to IRF-port 2 are on the right.
- The physical IRF connections are consistent with the IRF port bindings.
c. If there are binding errors or connection inconsistencies, reconfigure the IRF port bindings or reconnect the physical IRF ports.
5. Verify that all IRF links are up:
a. Execute the display irf topology command, and then check the Link field.
b. If the Link field for an IRF port displays DOWN, execute the display interface command, and then check the current state field.
- If all physical ports bound to the IRF port are down, bring them up.
- If the IRF port has at least one physical port in up state, go to step c.
c. Save the configuration, and then execute the irf-port-configuration active command in system view to activate the IRF port configuration.
|
|
IMPORTANT: Activating IRF port configuration requires a reboot. To prevent configuration loss, you must save the configuration before you execute the irf-port-configuration active command. |
6. Verify that all member devices use the same software version:
a. Execute the display version command to identify the software version of each member device.
b. Upgrade the software of all member devices to the same version.
|
|
NOTE: Typically, the irf auto-update enable command can automatically synchronize a member device with the software version of the master device. However, the synchronization might fail when the gap between the software versions is too large. For more information, see the release notes. |
7. If the problem persists, contact H3C Support.
Related commands
This section lists the commands that you might use for troubleshooting IRF.
|
Command |
Description |
|
display interface |
Displays interface information. Use this command to verify that each IRF port has at least one physical port in up state. |
|
display irf |
Displays IRF fabric information, including the member ID, role, priority, bridge MAC address, and description of each IRF member. |
|
display irf configuration |
Displays basic IRF settings, including the current member ID, new member ID, and physical ports bound to the IRF ports on each IRF member device. The new member IDs take effect at reboot. |
|
display irf topology |
Displays the IRF fabric topology, including the member IDs, IRF port state, and adjacencies of IRF ports. |
|
display version |
Displays system version information. |
|
irf-port-configuration active |
Activates IRF configuration on IRF ports. |
Troubleshooting Ethernet link aggregation
This section provides troubleshooting information for common problems with Ethernet link aggregation.
Link aggregation failure
Symptom
Link aggregation does not operate correctly.
Troubleshooting flowchart
Figure 3 Troubleshooting link aggregation failure
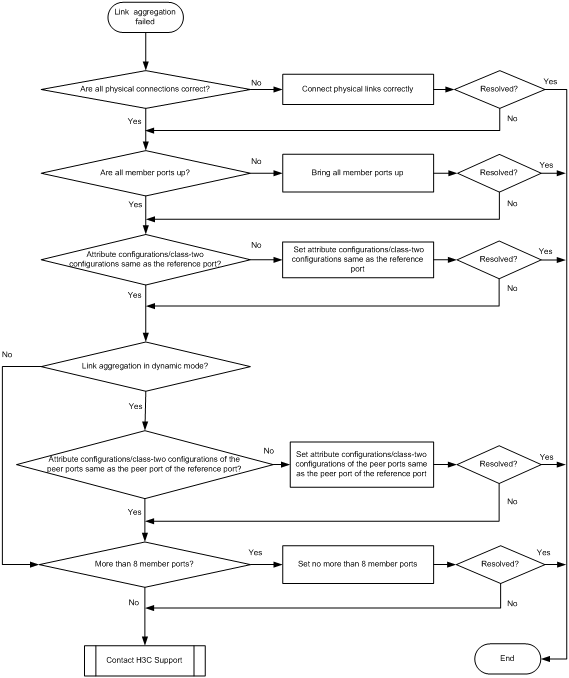
Solution
To resolve the problem:
1. Verify that all physical connections are correct.
You can verify the physical connections against your network plan.
2. Verify that all member ports are up:
a. Execute the display interface command to display the status of the member ports.
b. If the member ports are down, follow the solution in "Link up failure on a port" to troubleshoot the problem.
3. Verify that the member ports have the same attribute configurations and class-two configurations as the reference port:
a. Execute the display current-configuration interface command to display the configurations of the aggregate interface and the member ports.
b. Configure the member ports to make sure they have the same attribute configurations and class-two configurations as the reference port.
4. Identify the aggregation mode of the aggregation group.
? If the aggregation mode is static, proceed to step 6.
? If the aggregation mode is dynamic, proceed to step 5.
5. Verify that the peer member ports have the same attribute configurations and class-two configurations as the peer port of the reference port:
a. Execute the display current-configuration interface command on the peer device to display the configurations of the peer member ports.
b. Configure the peer member ports to make sure the peer ports have the same attribute configurations and class-two configurations as the peer port of the reference port.
6. Verify that the number of member ports in the aggregation group does not exceed eight.
a. Execute the display link-aggregation verbose command to verify that the number of member ports does not exceed eight.
If the number of member ports exceeds eight, the ports with higher port numbers are in Unselected state.
b. Use the undo port link-aggregation group command to remove undesired member ports from the aggregation group.
This ensures that all member ports you assign to the aggregation group can become Selected.
7. If the problem persists, contact H3C Support.
Related commands
This section lists the commands that you might use for troubleshooting Ethernet link aggregation.
|
Commands |
Description |
|
display current-configuration interface |
Displays interface configuration. |
|
display interface |
Displays Ethernet interface information. |
|
display link-aggregation verbose |
Displays detailed information about the aggregation groups that correspond to the Layer 2 or Layer 3 aggregate interfaces. |
Troubleshooting ports
This section provides troubleshooting information for common problems with ports.
Link up failure on a port
Symptom
A port cannot go up when the port is connected to another port.
Troubleshooting flowchart
Figure 4 Troubleshooting link up failure on a port
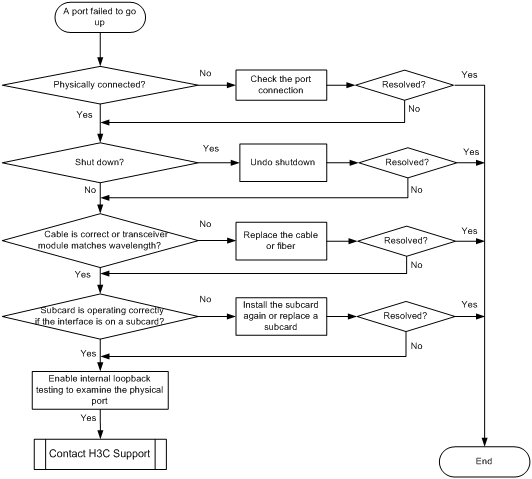
Solution
To resolve the problem:
1. Verify that the physical connection of the port is correct:
a. Unplug and then plug in the network cable of the port.
b. Verify that the port is up.
2. Verify that the port is not shut down:
a. Execute the display interface brief command.
b. Determine whether ADM appears in the second column of the output for the port.
c. If ADM appears, use the undo shutdown command to bring up the port.
3. Verify that the speed and duplex mode of the port match those of the peer port:
a. Execute the display interface brief command.
b. Determine whether the speed and duplex mode of the port match those of the peer port.
c. If they do not match, use the speed command and the duplex command to set the speed and duplex mode for the port.
4. Examine the network cable quality or verify that the transceiver module type of the fiber port matches the wavelength:
a. Replace the network cable with a new one, and verify that the port is up.
b. If the port is a fiber port, verify that the transceiver module type of the fiber port matches the wavelength.
If the transceiver module information is not on the label, use the display transceiver interface command to display the transceiver module information.
<Sysname>display transceiver interface ten-gigabitethernet 1/1/1
Ten-GigabitEthernet1/1/1 transceiver information:
Transceiver Type : 10G_BASE_SR_SFP
Connector Type : LC
Wavelength(nm) : 850
Transfer Distance(m) : 80(50um),30(62.5um)
Digital Diagnostic Monitoring : YES
Vendor Name : FINISAR CORP.
Ordering Name : SFP_XGE_SX-MM850
5. If the port is on a subcard, verify that the subcard is operating correctly:
a. Execute the display device command.
b. Determine whether Normal appears in the last column of the output for the subcard.
c. If Normal does not appear in the last column, re-plug in the subcard or replace the subcard with a subcard of the same model.
[Sysname]display device
Slot 1
SubSNo PortNum PCBVer FPGAVer CPLDVer BootRomVer AddrLM Type State
0 52 REV.C NULL 007 607 IVL MAIN Normal
1 2 REV.A NULL NULL NULL IVL 2*10GE Normal
6. Enable internal loopback testing on the port to verify that the physical port is operating correctly.
[Sysname-GigabitEthernet1/0/2]loopback internal
%Apr 26 12:40:25:309 2000 5500 IFNET/4/LINK UPDOWN:
GigabitEthernet1/0/2: link status is UP
%Apr 26 12:40:25:531 2000 5500 IFNET/4/LINK UPDOWN:
GigabitEthernet1/0/2: link status is DOWN
Loop internal succeeded!
7. If the problem persists, contact H3C Support.
Related commands
This section lists the commands that you might use for troubleshooting ports.
|
Command |
Description |
|
display device |
Displays device information. |
|
display interface brief |
Displays brief interface information. |
|
display transceiver interface |
Displays key parameters of the transceiver module installed in an interface. |
|
loopback internal |
Enables loopback testing on an Ethernet interface. |
Troubleshooting other problems
High CPU usage
Symptom
The display cpu-usage command shows that the CPU usage is high.
Troubleshooting flowchart
Figure 5 Troubleshooting high CPU usage

Solution
To resolve the problem:
1. Locate the tasks that are using CPU resources.
Use the display cpu-usage task [ slot slot-id ] command in hidden view to display CPU usage information. Locate the tasks that are using CPU resources.
2. Analyze the tasks that are using CPU resources.
The following are common tasks that use CPU resources:
? bRX1 and bRX2
If these tasks are using CPU resources, the switch might be receiving large amounts of packets that need to be forwarded to the CPU. Do the following:
- Use the display interface command to see whether interfaces have received large amounts of broadcast packets.
- Identify whether a loop exists on the network. If a loop exists, examine the connections between the devices.
? MSTP
Use the display stp bpdu-statistics interface command to view the statistics for received and sent BPDU packets on ports. Examine the counts of TCN/TC packets. If the switch receives a large quantity of TCN/TC packets generated by STP, the switch has to delete MAC address entries frequently. This results in high CPU usage.
? AGNT
Examine the network management software. Frequent MIB information browsing might result in high CPU usage.
? ROUT
Use the display ip routing-table command to examine route changes. Route flapping might cause high CPU usage.
? L2X0 or L2X1 MAC address synchronization
Examine whether the network topology is stable. If the network topology is not stable, the device has to use a lot of CPU resources to update its MAC address entries frequently.
3. If the problem persists, contact H3C Support.
Related commands
This section lists the commands that you might use for troubleshooting high CPU usage.
|
Command |
Description |
|
_hidecmd |
Enters hidden view. |
|
display cpu-usage task [ slot slot-id ] |
Displays CPU usage information. This command is available in hidden view. |
|
display interface |
Displays Ethernet interface information. |
|
display ip routing-table |
Displays brief information about active routes in the routing table. |
|
display stp bpdu-statistics interface |
Displays the BPDU statistics for a port. |
Layer 2 forwarding failure
Symptom
Layer 2 packet loss occurs between two devices on the same network segment and in the same VLAN.
Troubleshooting flowchart
Figure 6 Troubleshooting Layer 2 packet loss failure
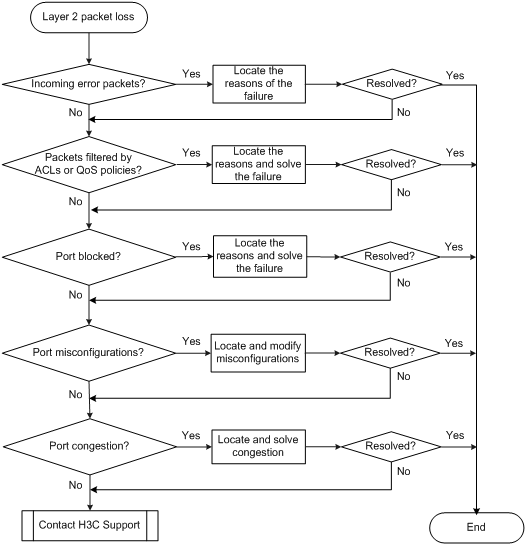
Solution
To resolve the problem:
1. Verify that no error packets have been received on the local port:
a. Execute the display interface command and check for error packets.
<H3C>display interface GigabitEthernet1/0/36
GigabitEthernet1/0/36 current state: UP
IP Packet Frame Type: PKTFMT_ETHNT_2, Hardware Address: 000f-e200-002b
……
Last 300 seconds output: 0 packets/sec 10 bytes/sec 0%
Input (total): 57 packets, 7838 bytes
0 unicasts, 50 broadcasts, 2 multicasts, 0 pauses
Input (normal): 52 packets, - bytes
0 unicasts, 50 broadcasts, 2 multicasts, 0 pauses
Input: 5 input errors, 0 runts, 0 giants, 0 throttles
5 CRC, 0 frame, - overruns, 0 aborts
- ignored, - parity errors
b. If the statistics are not zero, the following failures might occur:
- Interface hardware failure—To test such a failure, connect the cable that is connected to the local port to a correctly operating port (for example, Port A) that has the same configurations as the local port. If Port A forwards traffic correctly, you can determine that the hardware of the local port fails. In this event, you must replace the local port with a correctly operating port.
- Transceiver module, fiber, or twisted pair failure—To test and solve such a failure, replace the faulty transceiver module, fiber, or twisted pair with a good one.
- Inconsistent configurations—Verify that the configurations (such as speed and duplex mode) of the peer are consistent with the local port. If they are inconsistent, modify the configurations of the local port.
c. If the problem persists, contact H3C Support.
2. Verify that packets are not mistakenly filtered out by ACLs:
a. Examine the ACL and QoS policy configuration for packet filtering on the port, on the VLAN of the port, or globally. If packets are mistakenly filtered out, modify the ACL or QoS policy configuration.
- To display the ACL configuration on the port for packet filtering, execute the display packet-filter command.
- To display the QoS policy configuration on the port, execute the display qos policy command.
- To display the QoS policy configuration on the VLANs of the port, execute the display qos vlan-policy command.
- To display the global QoS policy configuration, execute the display qos policy global command.
b. Determine whether packets are filtered out by automatically created ACLs.
The following features automatically create ACLs:
- IP source guard—Configured by using the ip source binding or ip verify source command. To display source guard binding entries, execute the display ip source binding or display ipv6 source binding command. If IP source guard is configured but the packets do not match any entries, further troubleshoot the problem based on the way the binding entries are created.
- Portal authentication—When portal authentication is configured, the port discards the packets of unauthenticated users. To display the portal configuration of the port or the VLANs of the port, execute the display portal interface command. To cancel the portal configuration on the port, execute the undo portal command in Layer 2 Ethernet interface view. To cancel the portal configuration on the VLAN of the port, execute the undo portal server server-name command on the corresponding VLAN interface.
- EAD fast deployment—When EAD fast deployment is enabled, the port discards packets of unauthenticated users except when the users access only a free IP. To display whether EAD fast deployment is enabled on the port, execute the display dot1x command.
3. Verify that the port is not blocked:
? Execute the display stp brief command to determine whether STP sets the state of the port to discarding. When the port is in discarding state, it cannot forward traffic. H3C recommends disabling STP on the port, or configuring the port as an edge port if the port is connected to a terminal device.
? If the port belongs to an aggregation group, execute the display link-aggregation verbose command to identify the port status. When the port is an Unselected port, it cannot forward traffic. Find the reasons why the port is in Unselected state. For example, the attribute configurations of the port are different from the configurations of the reference port.
? Execute the display rrpp verbose command to determine whether one of the following has occurred:
- The port is down.
- RRPP has set the state of the port to blocked.
When the port is down or in blocked state, it cannot forward traffic.
- If the port is in down state, determine whether the port is physically or administratively shut down.
- If the port is in blocked state, find the reasons. For example, the roles of the primary and secondary port on the master node were reversed. Or, it might be that the broadcast storm suppression mechanism blocked the port because SRPT failure occurred in a multi-homed subring.
? Execute the display smart-link group command to determine whether Smart Link sets the state of the port to standby or down. When the port is in standby or down state, it cannot forward traffic.
If the port is in standby state, set the port as the primary port.
If the port is in down state, the follow reasons might apply, and further troubleshooting is required:
- The uplink device is configured with Monitor link, and its uplink is down.
- The link between the local port and its peer fails.
- The local port is administratively shut down.
4. Examine the following configurations that might cause packet loss:
? VLAN configuration—Execute the display this command in Ethernet interface view to display whether the port is in the VLAN of the packets. If not, add the port to the VLAN.
? Blackhole MAC address entries—Execute the display mac-address blackhole command to display blackhole MAC address entries. If the packets are discarded because they match a blackhole MAC address entry, delete the entry. To delete the blackhole MAC address entry, execute the undo mac-address blackhole mac-address vlan vlan-id command.
? Rate limit—Execute the display qos lr interface command to display the rate limit configuration on the port. If rate limit is configured on the port, make sure the committed information rate (CIR) and the committed burst size (CBS) are appropriate. To adjust the CIR and CBS values, execute the qos lr outbound cir committed-information-rate [ cbs committed-burst-size ] command.
? Storm suppression—Execute the display this command in Ethernet interface view to display the configuration of storm suppression. Storm suppression includes broadcast suppression, multicast suppression, and unknown unicast suppression. To adjust the suppression thresholds, execute the broadcast-suppression, multicast-suppression, and unicast-suppression commands, respectively.
5. If the output of the display interface command shows packet loss on the port, determine whether congestion occurs on the port by referencing related congestion management documents, and resolve the issue.
6. If the problem persists, contact H3C Support.
Related commands
This section lists the commands that you might use for troubleshooting Layer 2 packet loss failure.
|
Command |
Description |
|
display dot1x |
Displays information about 802.1X. |
|
display interface |
Displays Ethernet interface information. |
|
display ip source binding/display ipv6 source binding |
Displays source guard binding entries. |
|
display link-aggregation verbose |
Displays detailed information about the aggregation groups that correspond to the aggregate interfaces. |
|
display mac-address blackhole |
Displays blackhole MAC address entries. |
|
display packet-filter |
Displays whether an ACL has been successfully applied to an interface for packet filtering. |
|
display portal interface |
Displays the portal configuration of an interface. |
|
display qos lr interface |
Displays the rate limit configuration and statistics on a specified interface or all the interfaces. |
|
display qos policy |
Displays user-defined QoS policy configuration information. |
|
display qos policy global |
Displays information about global QoS policies. |
|
display qos policy interface |
Displays information about the QoS policies applied to an interface or all interfaces. |
|
display qos vlan-policy |
Displays information about QoS policies applied to VLANs. |
|
display rrpp verbose |
Displays detailed RRPP information. |
|
display smart-link group |
Displays information about the specified or all smart link groups. |
|
display stp |
Displays the spanning tree status and statistics. |
|
display this |
Displays the running configuration in the current view. |
Layer 3 forwarding failure
Symptom
Packet loss occurs when the switch forwards packets to a different network.
Troubleshooting flowchart
Figure 7 Troubleshooting Layer 3 forwarding failure
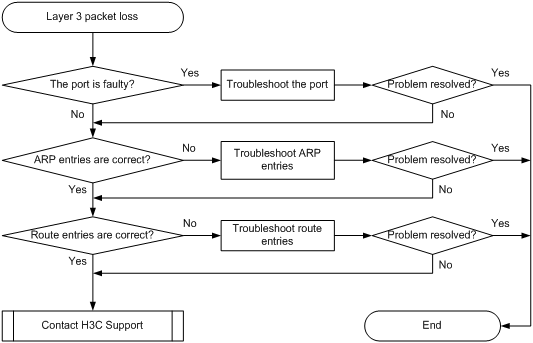
Solution
To resolve the problem:
1. Verify that the port is not faulty (due to hardware or configuration problems):
? If the port is faulty, follow the solution in "Layer 2 forwarding failure" to troubleshoot the problem.
? If the port is not faulty, go to step 2.
2. Verify that ARP entries are correct by using the display arp command:
? If incorrect ARP entries exist, execute the debugging arp packet command to locate the problem.
? If the switch does not learn any ARP entries, you can execute the arp static command to configure static ARP entries.
? If ARP entries are correct, go to step 3.
3. Verify that the route entries are correct by using the display ip routing-table command:
? If incorrect route entries exist, troubleshoot the protocol that learns the route entries.
? If route entries are correct but the problem persists, contact H3C Support.
Related commands
This section lists the commands that you might use for troubleshooting Layer 3 forwarding failure.
|
Command |
Description |
|
debugging arp packet |
Enables ARP packet debugging. |
|
display arp |
Displays ARP entries. |
|
display ip routing-table |
Displays brief information about active routes in the routing table. |
PoE power supply anomaly
S5500-28C-PWR-EI, S5500-52C-PWR-EI, S5500-28C-PWR-SI, and S5500-52C-PWR-SI each include the following models:
· PoE+—Maximum PoE power per port is 30 W.
· PoE—Maximum PoE power per port is 15.4 W.
The command output varies with device models.
Symptom
The PoE device cannot supply power correctly.
Troubleshooting flowchart
Figure 8 Troubleshooting PoE power supply anomaly
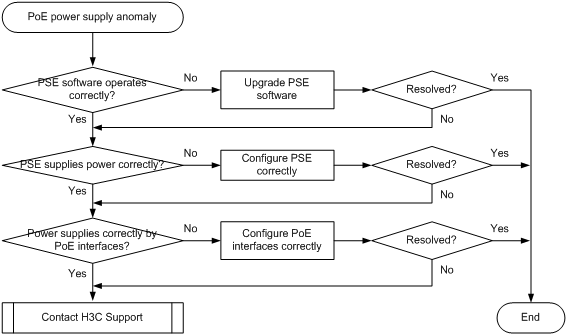
Solution
To resolve the problem:
1. Execute the following commands to display power supply information:
a. Execute the display poe device command in any view to display PSE information. Check the faulty field to identify PSE problems.
<Sysname> display poe device
PSE ID SlotNo SubSNo PortNum MaxPower(W) State Model
4 1 0 24 370 faulty PD67024
The output shows that the PSE has problems.
b. Execute the poe update command to upgrade the PSE processing software in service.
<Sysname> system-view
[Sysname] poe update full ver_3_9_0_release.bin pse 4
This command will fully update firmware on the specific PSE(s), Continue? [Y/N]:y
System is downloading firmware into the hardware. Please wait
Update firmware on the specific PSE(s) successfully!
The output shows that the PSE processing software has been upgraded.
c. Execute the display poe device command again to display PSE information. Check the on or off field for the PSE state.
[Sysname] display poe device
PSE ID SlotNo SubSNo PortNum MaxPower(W) State Model
4 1 0 24 370 off PD67024
The output shows that the PSE problem has been resolved.
d. Execute the display poe pse command in any view to display detailed PSE information. Verify the following:
- The current power, average power, and peak power of the PSE are correct.
- Nonstandard PD detection by the PSE is enabled.
[Sysname] display poe pse
PSE ID : 4
PSE Slot No : 1
PSE SubSlot No : 0
PSE Model : PD67024
PSE Power Enabled : enabled
PSE Power Priority : -
PSE Current Power : 0 W
PSE Average Power : 0 W
PSE Peak Power : 0 W
PSE Max Power : 370 W
PSE Remaining Guaranteed : 370 W
PSE CPLD Version : -
PSE Software Version : 501
PSE Hardware Version : 1
PSE Legacy Detection : disabled
PSE Utilization-threshold : 80
PSE Pd-policy Mode : disable
PSE PD Disconnect Detect Mode : AC
If the current power, average power, and peak power of the PSE are close to or reach the maximum power of the PSE, PoE power has reached its maximum power supply capability.
If the PSE Pd-policy Mode field displays disable, execute the poe legacy enable pse command to enable nonstandard PD detection by the PSE.
e. Execute the display poe interface gigabitethernet 1/0/1 command in any view to display power supply information for GigabitEthernet 1/0/1. Verify the following:
- The current power, average power, and peak power of the PoE interface are correct.
- The PoE interface current and voltage are correct.
<Sysname> display poe interface gigabitethernet 1/0/1
Port Power Enabled : disabled
Port Power Priority : low
Port Operating Status : off
Port IEEE Class : 0
Port Detection Status : disabled
Port Power Mode : signal
Port Current Power : 0 mW
Port Average Power : 0 mW
Port Peak Power : 0 mW
Port Max Power : 30000 mW
Port Current : 0 mA
Port Voltage : 0.0 V
Port PD Description :
If the current power, average power, and peak power of the PoE interface are close to or reach the maximum power of the PoE interface, execute the poe max-power command to configure the maximum power with higher-wattage supply.
2. If the problem persists, contact H3C Support.
Related commands
This section lists the commands that you might use for troubleshooting PoE.
|
Command |
Description |
|
display poe device |
Displays PSE information. |
|
display poe interface interface-type interface-number |
Displays power supply information for PoE interfaces. |
|
display poe pse |
Displays detailed PSE information. |
|
poe legacy enable pse |
Enables the PSE to detect nonstandard PDs. |
|
poe max-power |
Configures the maximum power for a PoE interface. |
